Gross Domestic Product (GDP)
5paisa Capital Ltd


- What Is Gross Domestic Product (GDP)?
- Understanding Gross Domestic Product
- How does GDP affect me?
- Importance of GDP
- How GDP is measured?
- Types of Gross Domestic Product
- GDP Formula
- GDP vs GNP vs GNI
- How to Use GDP Data
- History of GDP
- What are the limitations of GDP?
- Global Sources for Country GDP Data
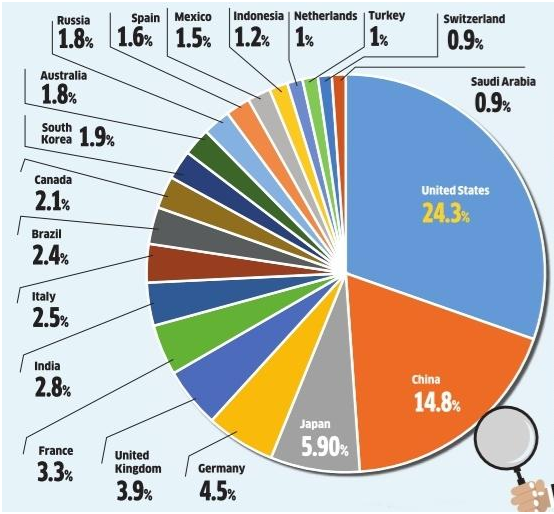
- % Share of the Global Economy
The full form of GDP is the Gross Domestic Product, a useful economic indicator. Economic indicators are statistical measures that provide insights into a country's financial performance and trends. These indicators include employment, inflation, production, consumption, trade, and investment data.
By providing information on the current economic conditions and future trends, economic indicators help forecast the economy's direction and identify potential risks and opportunities. They are essential tools for evaluating economic progress and development and play a critical role in guiding policy decisions at the national and international levels.


More Articles to Explore
- Difference between NSDL and CDSL
- Lowest brokerage charges in India for online trading
- How to find your demat account number using PAN card
- What are bonus shares and how do they work?
- How to transfer shares from one demat account to another?
- What is BO ID?
- Open demat account without a PAN card - a complete guide
- What are DP charges?
- What is DP ID in a demat account
- How to transfer money from demat account to bank account
Disclaimer: Investment in securities market are subject to market risks, read all the related documents carefully before investing. For detailed disclaimer please Click here.
Frequently Asked Questions
The United States has the highest nominal GDP, followed by China, Japan, and Germany.
High GDP can indicate a strong and growing economy, leading to increased employment opportunities, higher standards of living, and greater access to goods and services.
As of 2021, India has a nominal GDP of approximately $3 trillion and a GDP per capita of around $2,200.
Tracking GDP is important because it provides a standardised measure of economic activity, which allows policymakers, investors, and researchers to analyse economic trends and make informed decisions.