
Breakout Stock to Watch: Mining Equipment Stock Breaks Out of Multi-Year Consolidation

 Indrashish Mitra
- 0 min read
Indrashish Mitra
- 0 min read
Last Updated: 21st September 2026 - 06:27 pm

The broader market has remained volatile, but several stocks continue to display strong technical structures and fresh breakout opportunities. One such stock is Tega Industries (TEGA), which has delivered a decisive breakout on the weekly chart after spending several years within a broad consolidation pattern. The latest move has been accompanied by a sharp rise in volume, making the stock one to watch for the coming sessions.
Breakout Stock to Watch for Swing Trading: Tega Industries (TEGA)
Tega Industries is a global manufacturer of critical-to-operate consumables used across the mining, mineral processing and material handling industries. Its product portfolio includes mill liners, conveyor components, wear products, screens and trommels, and hydrocyclones. The company has a global presence across multiple countries and serves customers in the mining and mineral processing space.
From a long-term perspective, the stock has been consolidating within a broad price structure for several years. The recent price action indicates a significant improvement in buying interest, with the stock now moving above the upper boundary of this long-term consolidation.
Technical Setup: Stock Breaks Out of Multi-Year Consolidation
From a technical perspective, Tega Industries has formed a large multi-year triangular consolidation pattern on the weekly chart. The stock has been making higher lows from the 2025 bottom while facing resistance around the Rs 1,950–2,000 zone, creating a contracting price structure.
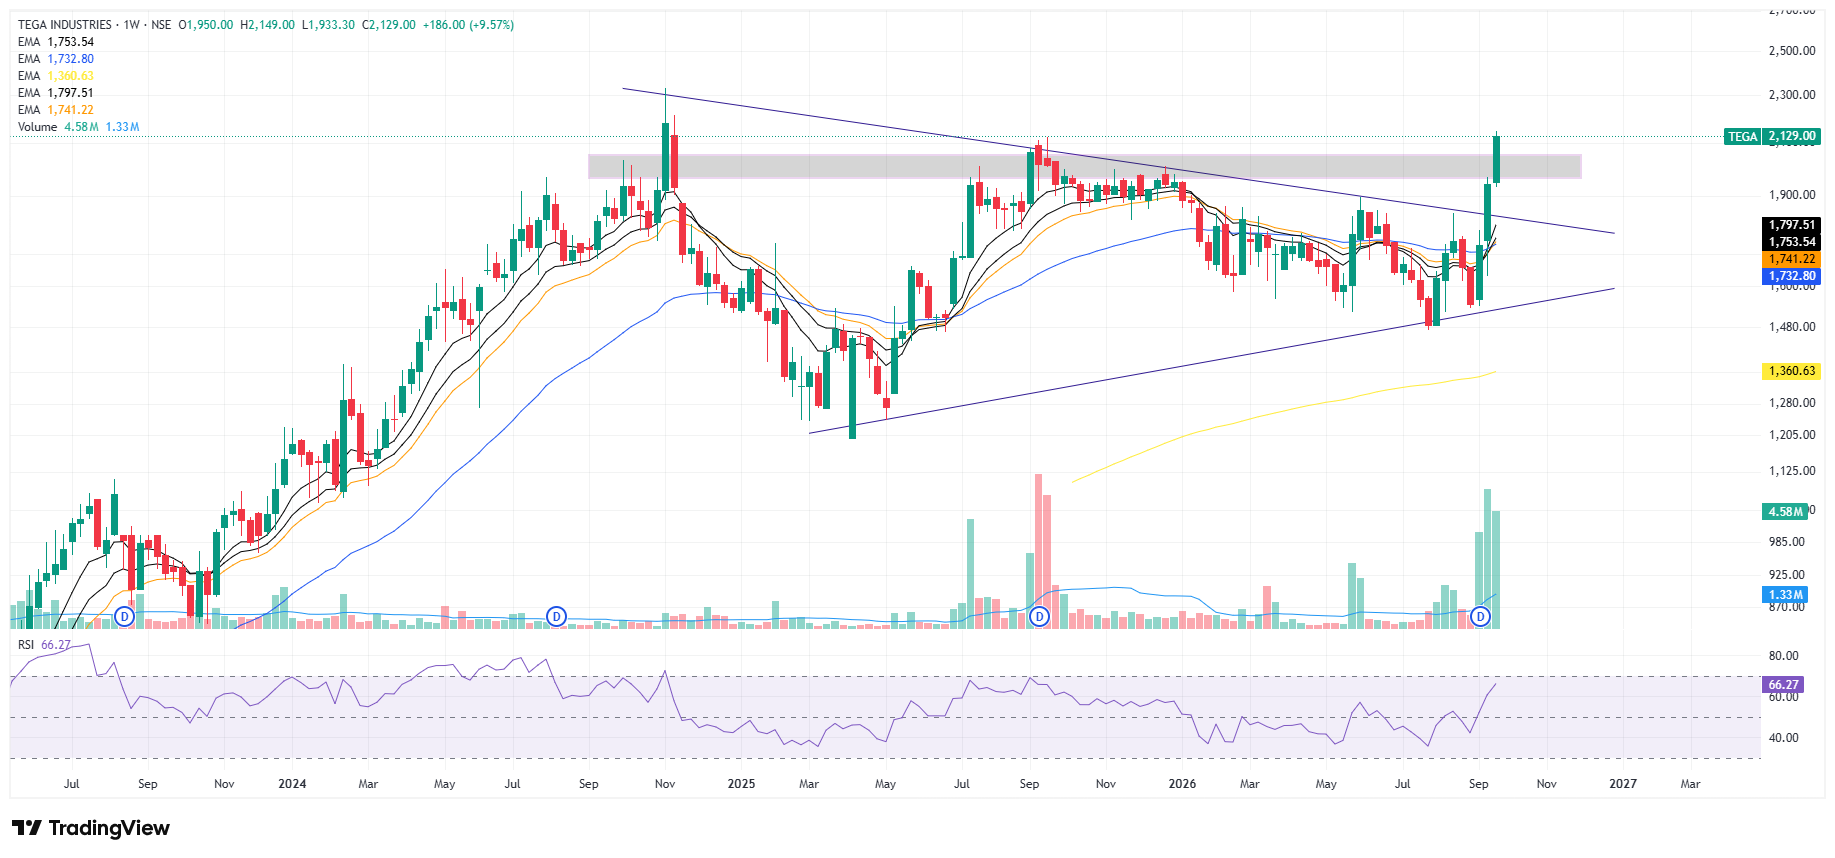
The latest weekly candle has broken decisively above the Rs 2,000–2,050 resistance zone as well as the falling trendline of the pattern. The stock surged nearly 9.6% in the current weekly session and touched a high of Rs 2,149, confirming strong buying interest. Volume has also expanded sharply to around 4.58 million shares, compared with the average volume of approximately 1.33 million shares, indicating significant participation during the breakout.
The stock is also trading above its key weekly EMAs, including the 20-week EMA around Rs 1,798 and 50-week EMA around Rs 1,733, further supporting the breakout structure.
Momentum Indicators Turn Positive
The momentum setup has strengthened significantly following the breakout. The 14-period weekly RSI has moved up to 66.27, indicating strong bullish momentum and moving closer to the overbought zone without yet reaching an extreme level.
The price is also trading well above the major EMA cluster, while the rising short-term averages indicate improving trend strength. The combination of the multi-year breakout, strong volume expansion and rising RSI suggests that momentum has strengthened considerably on the weekly timeframe.
Trading Strategy and Key Levels
Considering the multi-year breakout, sustaining above the Rs 2,000–2,050 zone would keep the positive momentum intact. On the upside, the stock could move towards the Rs 2,300–2,400 range, with the previous major swing-high zone around Rs 2,300 acting as an important reference level.
Traders can maintain a stop loss around Rs 1,900 to manage downside risk. A sustained move above the breakout zone with continued volume support could strengthen the long-term breakout structure, while a move back below Rs 1,900–1,850 would require caution as it could weaken the breakout setup.
- Flat ₹20 Brokerage
- Next-gen Trading
- Advanced Charting
- Actionable Ideas
Trending on 5paisa
Disclaimer: Investment in securities market are subject to market risks, read all the related documents carefully before investing. For detailed disclaimer please Click here.