
Breakout Stock to Watch: Banking Stock Breaks Out of Rectangle Pattern

 Varda Khade
- 0 min read
Last Updated: 20th November 2026 - 06:51 pm

The broader market has witnessed volatility in recent sessions, but stock-specific opportunities continue to emerge as several companies show strong price action and improving technical structures. One such stock is City Union Bank (CUB), which has witnessed a strong breakout on the daily chart, supported by a sharp rise in volume and improving momentum.
Breakout Stock to Watch for Swing Trading: City Union Bank (CUB)
City Union Bank is a private sector bank in India, offering a range of banking and financial services, including retail banking, business banking, lending, deposits and digital banking solutions. The bank has a strong presence among small businesses, commercial customers and retail borrowers.
The stock has been trading within a broad consolidation range over the past several months, with buying interest emerging near the lower boundary and resistance developing around the Rs 238–240 zone. The recent price action indicates renewed buying interest, as the stock has moved decisively above its long-standing resistance, setting the stage for a potential continuation of the broader uptrend.
Technical Setup: Stock Breaks Out of Rectangle Pattern
From a technical perspective, City Union Bank has formed a rectangle consolidation pattern on the daily chart. The stock has been trading within a broad range of approximately Rs 207–238 over the past few months. Repeated selling pressure near the upper boundary and buying interest near the lower boundary kept the stock within this consolidation structure.
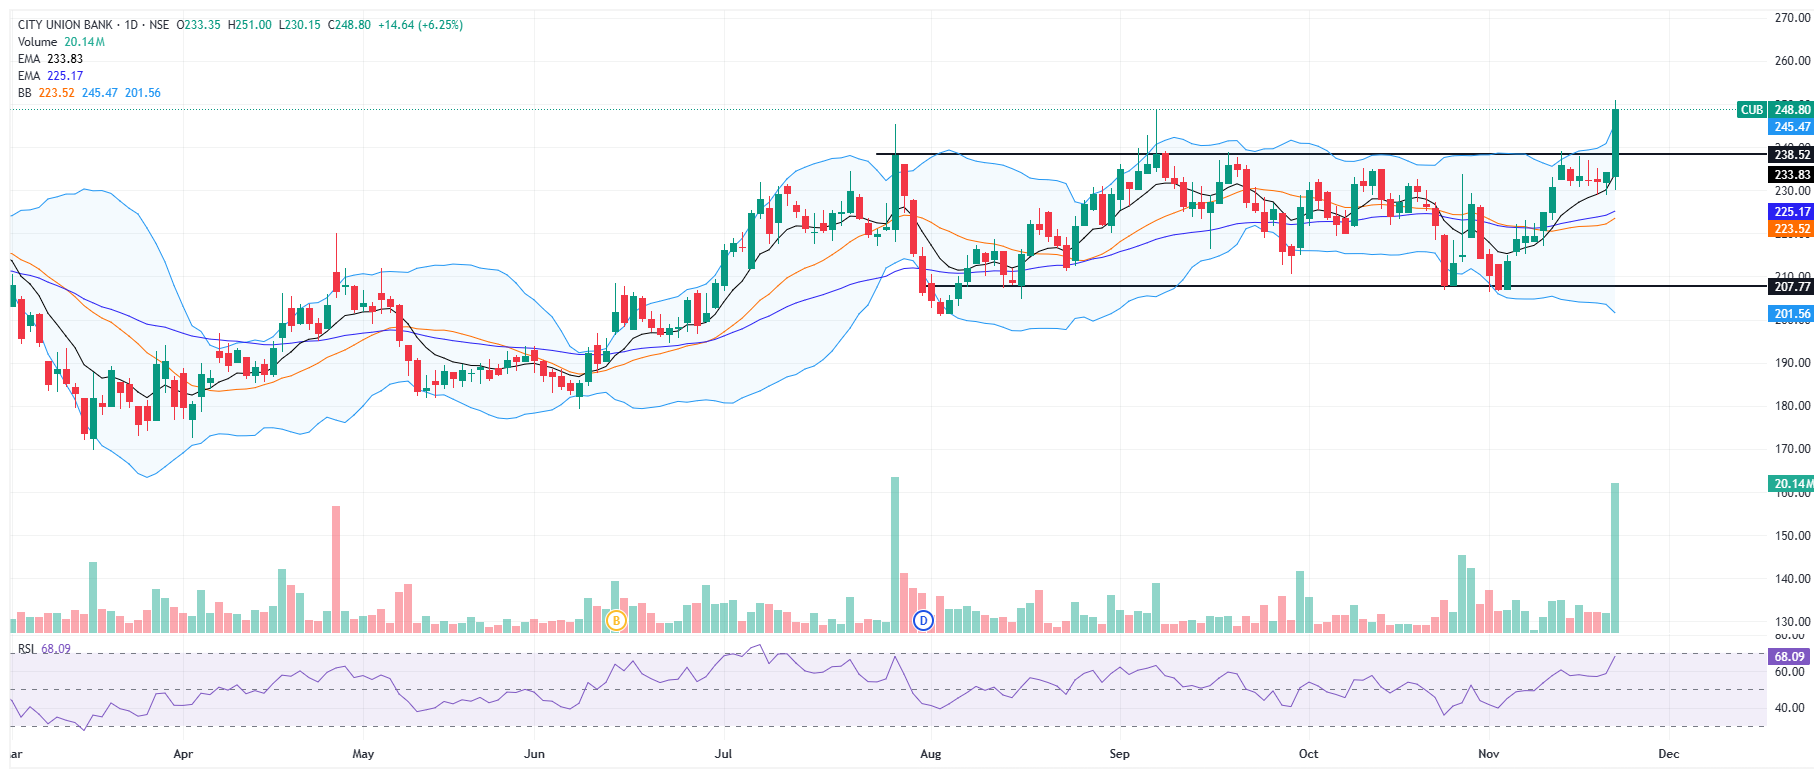
The stock has now broken above the Rs 238–240 resistance zone with a strong bullish candle and closed at Rs 248.80, gaining 6.25%. Volume surged to approximately 20.14 million shares, indicating strong participation during the breakout. The decisive move above the consolidation range suggests a potential continuation of the bullish trend and strengthens the technical setup.
Momentum Indicators Turn Positive
The technical setup remains supportive, with City Union Bank trading above its key short- and medium-term moving averages. The 20 EMA stands at Rs 233.83, while the 50 EMA is around Rs 225.17, indicating improving trend strength.
The stock has also moved above the upper Bollinger Band, with the upper band positioned near Rs 245.47, highlighting strong price momentum and volatility expansion. The 14-period daily RSI stands at 68.09, reflecting strong bullish momentum while approaching the overbought zone. The combination of a range breakout, volume expansion and improving momentum indicators supports the positive technical outlook.
Trading Strategy and Key Levels
Considering the strong breakout from the rectangle formation, sustaining above the Rs 238–240 zone would keep the positive momentum intact. On the upside, the stock could move towards the Rs 260–270 range, based on the height of the previous consolidation range, followed by higher levels if the breakout sustains with continued buying interest.
Traders can keep a stop loss around Rs 233 to manage downside risk. A sustained hold above Rs 240 would strengthen the breakout structure, while a move back below the breakout zone could weaken the setup.
- Flat ₹20 Brokerage
- Next-gen Trading
- Advanced Charting
- Actionable Ideas
Trending on 5paisa
Disclaimer: Investment in securities market are subject to market risks, read all the related documents carefully before investing. For detailed disclaimer please Click here.