
Nifty Trade Setup for November 5: Nifty 50 Extends Rally, Approaches 24,000 Mark

 Indrashish Mitra
- 0 min read
Last Updated: 4th November 2026 - 05:02 pm

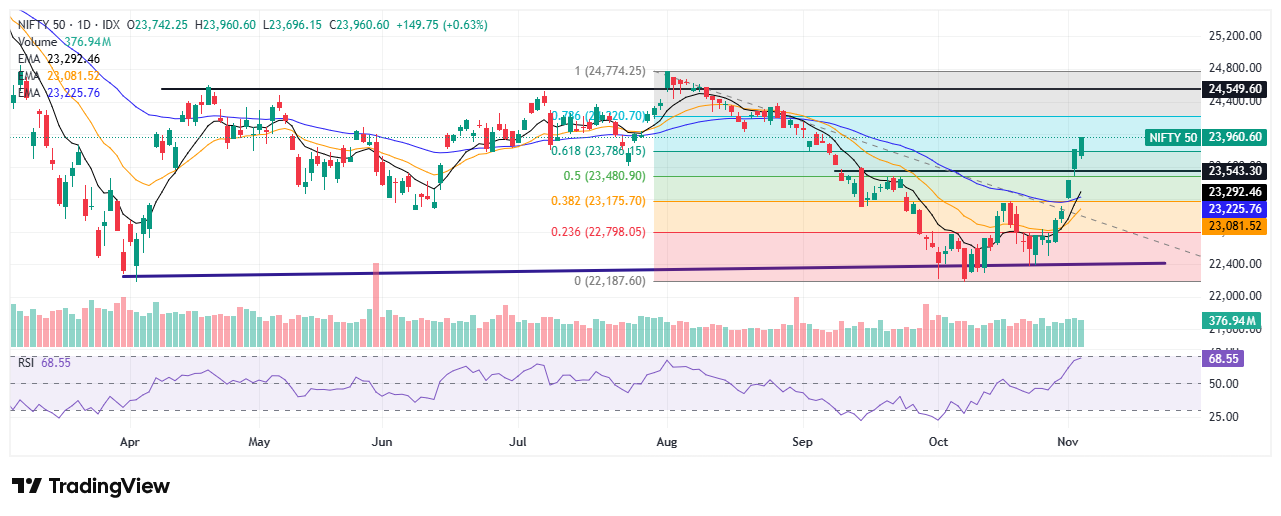
The Nifty 50 continued its upward momentum on Wednesday, closing at 23,960.60, up 149.75 points or 0.63%. The index opened at 23,742.25, touched an intraday high of 23,960.60 and a low of 23,696.15. Sustained buying interest kept the benchmark in positive territory, bringing it closer to the psychological 24,000 mark after a strong recovery over the past few sessions.
Market Breadth: Positive Participation Supports Market Sentiment
Market breadth remained positive, with 35 stocks advancing and 15 declining in the Nifty 50. The Nifty Media, Nifty Realty and Nifty Metal sectors emerged as the leading contributors. The broader participation from multiple sectors indicates that buying interest continues to support the ongoing recovery, although traders may remain cautious as the index approaches a crucial resistance zone.
Nifty Technical Setup: Fibonacci Levels Remain in Focus
On the daily chart, the Nifty 50 is trading above its short-term EMAs at 23,292.46 and 23,081.52, reflecting a strengthening trend. The index has also moved above the 61.8% Fibonacci retracement level at 23,786.15 and is approaching the 78.6% retracement level at 24,216.70. The next major resistance remains near the previous swing high of 24,774.25. On the hourly chart, the index is trading above all key EMAs, confirming strong momentum. However, the 24,000–24,216 zone could act as an immediate hurdle.
RSI and Momentum Indicators: Bullish Momentum Remains Strong
The daily RSI stands at 68.55, indicating strong bullish momentum and approaching overbought territory. The hourly RSI is at 76.84, while the 15-minute RSI is at 70.48, suggesting elevated short-term momentum. Although the indicators continue to favour the bulls, the higher RSI readings suggest that some consolidation or profit booking may emerge near resistance levels.
Key Levels to Track for Nifty on November 5
The Nifty 50 continues to maintain a bullish structure, supported by positive market breadth, trading above key moving averages and sustaining above the 61.8% Fibonacci retracement level of 23,786.15. A decisive move above 24,000 could strengthen the momentum towards 24,216.70, the next key Fibonacci resistance. However, elevated RSI readings across timeframes warrant caution against chasing prices at higher levels. On the downside, 23,786.15 remains an important level to watch, followed by the 23,480.90 support zone.
- Performance Analysis
- Nifty Outlook
- Market Trends
- Insights on Market
Trending on 5paisa
Disclaimer: Investment in securities market are subject to market risks, read all the related documents carefully before investing. For detailed disclaimer please Click here.