
Nifty Trade Setup for October 29: Nifty Slips 0.22%, Can the 50% Fibonacci Level Hold?

 Varda Khade
- 0 min read
Last Updated: 28th October 2026 - 06:08 pm

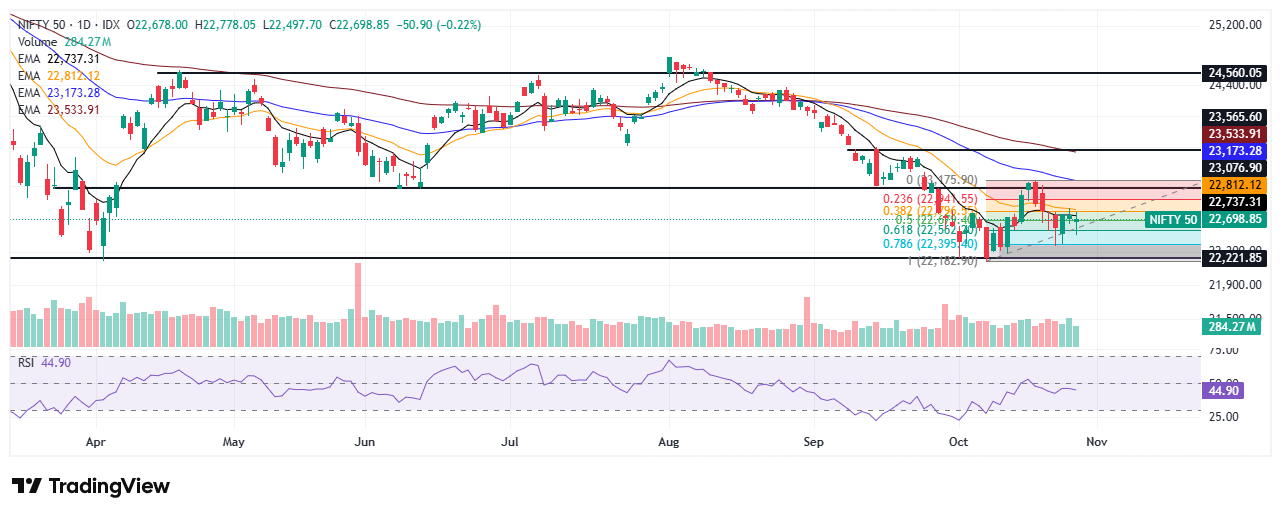
The Nifty 50 closed at 22,698.85 on Wednesday, declining 50.90 points or 0.22%. The index opened at 22,678.00, touched a high of 22,778.05 and recorded a low of 22,497.70. Despite recovering from the intraday low, Nifty remains below key daily moving averages, keeping the broader technical setup cautious. The index is trading close to its 50% Fibonacci retracement level, making this zone important for determining whether the recent recovery can continue or selling pressure will intensify.
Market Breadth: Slightly Positive Participation
Market breadth was marginally positive, with 26 stocks advancing and 24 declining among the Nifty 50 constituents. Nifty Auto, Consumer Durables and Media were among the stronger sectors. However, the nearly balanced advance-decline ratio indicates mixed participation, suggesting that the market has yet to establish a decisive directional trend.
Nifty Technical Setup: 22,796 Is the Immediate Fibonacci Hurdle
Nifty is trading below its daily EMAs near 22,737 and 22,812, keeping the broader trend under pressure. The index is also facing resistance around the 38.2% Fibonacci retracement level at 22,796.55. A sustained move above this level could open the way towards 22,941.55, the 23.6% retracement level, followed by horizontal resistance at 23,076.90. On the downside, the 50% retracement near 22,679 is the immediate pivot, while 22,562.20 and 22,395.40 are the next important Fibonacci support levels.
Fibonacci Retracement Analysis: 22,679 Is the Key Pivot
Based on the swing low of 22,182.90 and swing high of 23,175.90 marked on your chart, Nifty is trading just above the 50% Fibonacci retracement level at approximately 22,679. This zone is important because holding above it could help the index stabilize and attempt another recovery. A move above 22,796.55 would strengthen the short-term setup, while a sustained break below 22,679 could bring 22,562.20 into focus. Further weakness may expose the 78.6% retracement level at 22,395.40, followed by the major horizontal support at 22,221.85 and the swing low near 22,182.90.
RSI and Momentum Indicators: Recovery Lacks Strong Confirmation
The daily RSI stands at 44.90, indicating that broader momentum remains below the neutral 50 mark. The hourly RSI is at 50.92, while the 15-minute RSI is at 52.95, suggesting mildly positive short-term momentum. Although the intraday indicators show some resilience, the daily RSI and position below key moving averages indicate that stronger confirmation is needed before the broader trend improves.
Key Levels to Track for Nifty on October 29
Nifty's near-term direction will depend on whether it can sustain above the 50% Fibonacci retracement around 22,679. Holding this level could support a recovery towards 22,796.55 and 22,941.55, while a sustained move above 23,076.90 would improve the technical outlook further. Conversely, a decisive break below 22,679 may expose 22,562.20 and 22,395.40. With the daily RSI still below 50 and the index below key moving averages, traders should watch these Fibonacci levels closely for confirmation.
- Performance Analysis
- Nifty Outlook
- Market Trends
- Insights on Market
Trending on 5paisa
Disclaimer: Investment in securities market are subject to market risks, read all the related documents carefully before investing. For detailed disclaimer please Click here.