
Nifty Trade Setup for October 12: Nifty Rebounds 1.30% From 52-Week Low, Is a Recovery Taking Shape?

 Varda Khade
- 0 min read
Varda Khade
- 0 min read
Last Updated: 9th October 2026 - 05:32 pm

The Nifty 50 staged a strong rebound on October 9, rising 288.65 points or 1.30% to close at 22,520.45 after Thursday's sharp sell-off. The index recovered from an intraday low of 22,294.75 and moved towards the day's high of 22,580.75. Buying interest in IT stocks, supported by positive earnings-related sentiment, helped lift the benchmark. However, the broader technical structure remains weak, and the recovery will need follow-through to signal a more durable reversal.
Market Breadth Turns Strongly Positive as Buying Returns
Market breadth improved sharply, with 46 stocks advancing and only 4 declining among the Nifty 50 constituents. Nifty50 IT, Nifty50 Digital India and Nifty50 FMCG were the leading sectors in the recovery. The strong advance-decline ratio indicates broad participation in Friday's rebound after widespread selling in the previous session. However, one positive session alone does not confirm a trend reversal, particularly while the index remains below several key moving averages.
Nifty Technical Setup: Recovery Faces Resistance Near 22,600–22,800
On the daily chart, Nifty recovered above the 22,221.85 support zone after testing lower levels in the previous session. The daily RSI improved to 36.50, indicating that bearish momentum has eased from deeply oversold territory. However, the index remains below its major EMAs, including the short-term average near 22,635 and the next resistance zone around 22,947. The broader trend therefore remains under pressure unless Nifty can sustain its recovery above these levels.
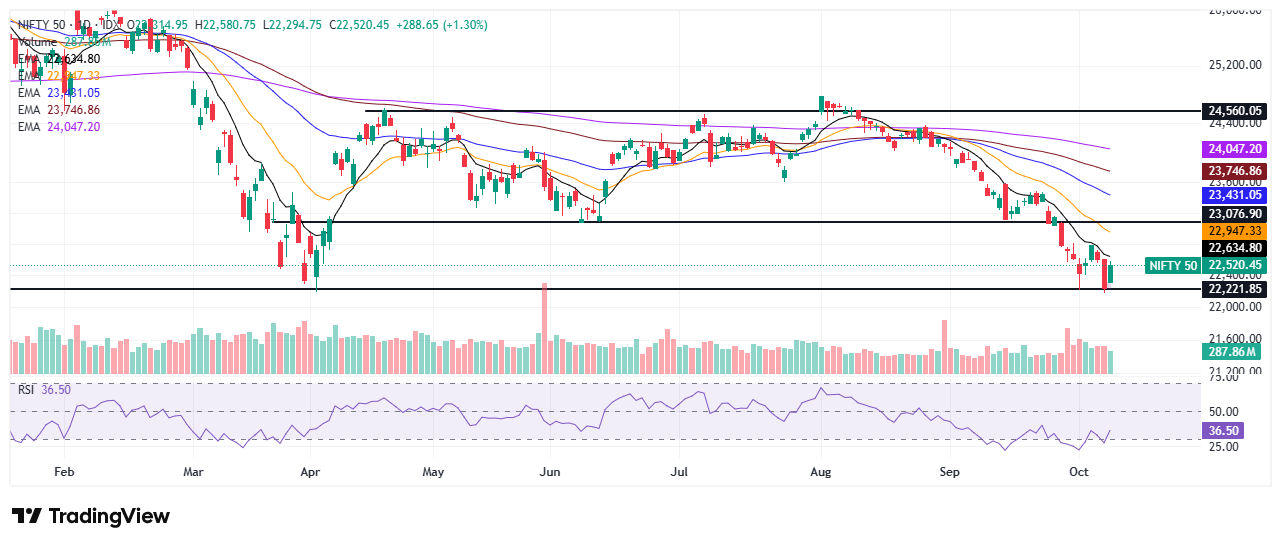
On the hourly chart, the index moved above the short-term EMA cluster near 22,481–22,487, while the hourly RSI recovered to 51.18, suggesting an improvement in near-term momentum. The 15-minute RSI stands at 56.85, although the index is facing resistance around 22,530–22,635. A sustained move above this zone could strengthen the rebound, while a drop below 22,480 may weaken the immediate recovery.
RSI Recovers as Short-Term Momentum Improves
The daily RSI at 36.50 remains below the neutral 50 mark, showing that the broader momentum is still weak despite Friday's gains. In contrast, the hourly RSI at 51.18 and the 15-minute RSI at 56.85 indicate improving short-term buying momentum. This divergence between the daily and intraday charts suggests that a relief rally is underway, but confirmation of a broader reversal will depend on whether Nifty can reclaim higher EMA resistance levels.
Key Levels to Track for Nifty
For the next session, 22,480–22,500 is the immediate support zone, followed by the major support at 22,221.85. On the upside, 22,580–22,635 is the first resistance area, followed by 22,800–22,950. A sustained move above 22,635 could extend the recovery towards 22,800, while a break above 22,950 would improve the broader technical setup. However, failure to hold 22,480 could bring selling pressure back, putting 22,221.85 into focus.
- Performance Analysis
- Nifty Outlook
- Market Trends
- Insights on Market
Trending on 5paisa
Disclaimer: Investment in securities market are subject to market risks, read all the related documents carefully before investing. For detailed disclaimer please Click here.