
Breakout Stock to Watch: High Relative Strength Stock Gives Fresh Breakout from Flag Pattern

 Varda Khade
- 0 min read
Varda Khade
- 0 min read
Last Updated: 11th September 2026 - 04:51 pm

The week gone by remained challenging for the Indian equity market, with the Nifty 50 closing lower in four of the five trading sessions. The index also extended its weekly losing streak to five weeks, declining 2.09%. Despite weakness in the broader market, stock-specific opportunities continued to emerge.
For the coming week, TD Power Systems is one stock that traders can keep on their radar from a swing trading perspective.
Stock to Watch: TD Power Systems
TD Power Systems Limited manufactures AC generators and motors used across critical infrastructure and power generation applications. Its product portfolio caters to both conventional and renewable energy segments, including steam turbines, gas engines, gas turbines, hydro, diesel, geothermal and wind power projects.
The company also supplies motors to specialised industrial sectors such as oil and gas. Backed by relationships with leading original equipment manufacturers (OEMs) and utilities, TD Power Systems has built a presence across domestic as well as international power equipment markets.
TD Power Systems Stock in Focus Strong Flag Pattern Breakout
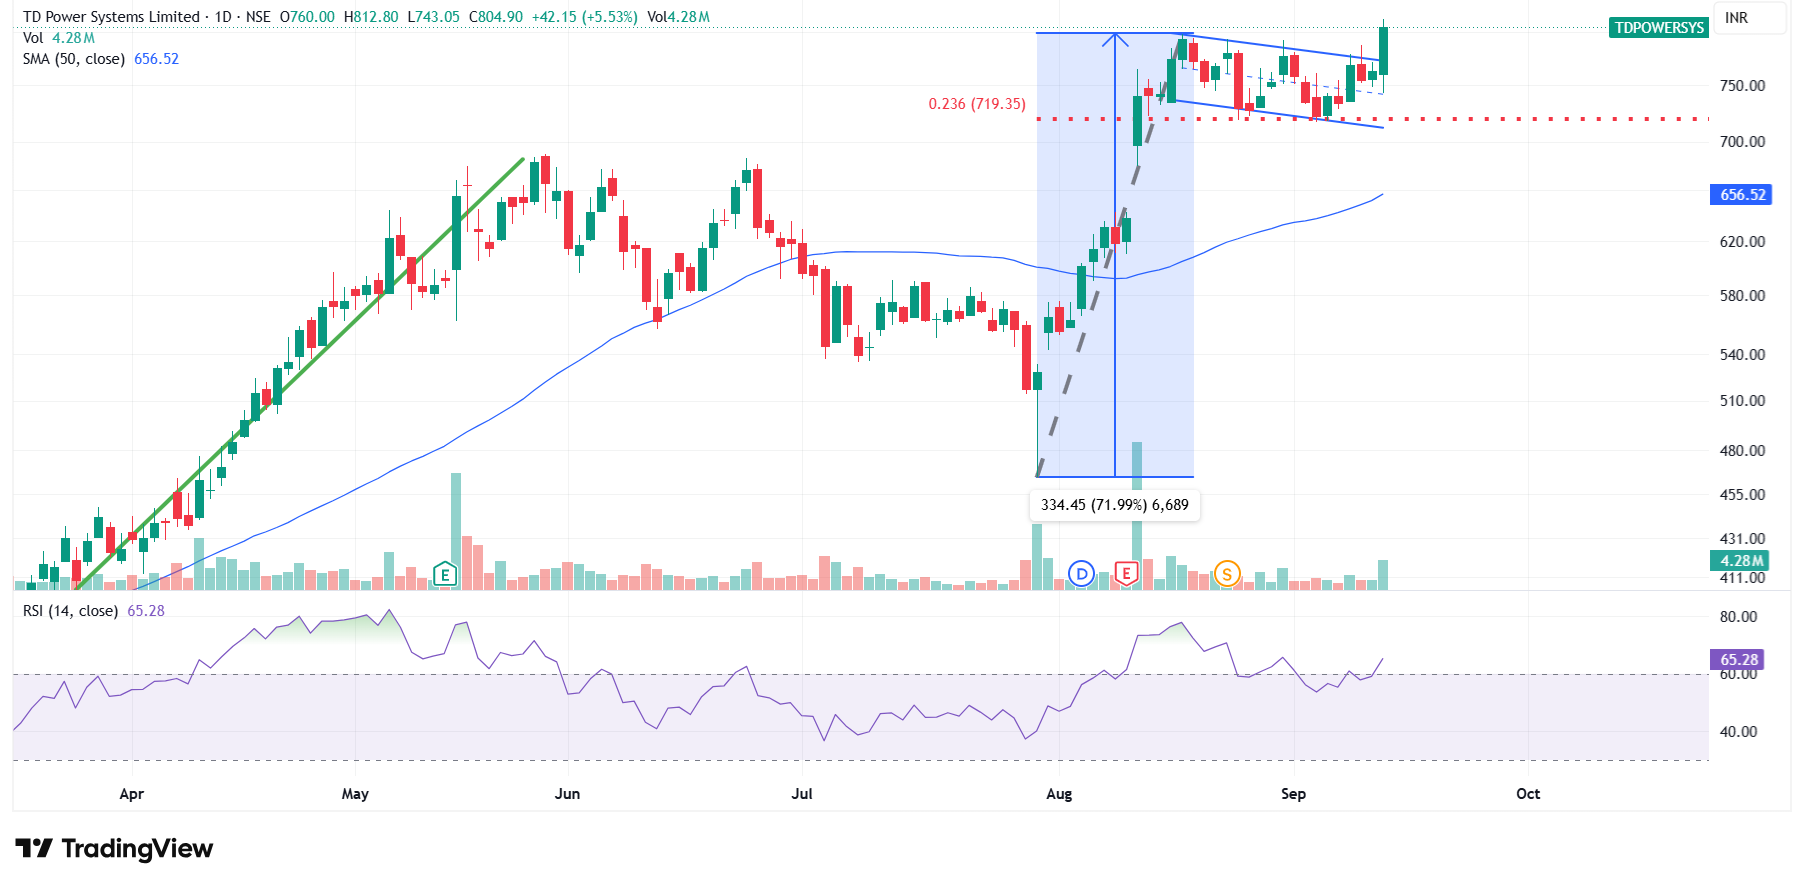
On the technical front, the stock rallied nearly 72% from its July low to the August high. Following this sharp upmove, it entered a corrective phase but retraced only around 23.6% of the entire rally, indicating limited selling pressure.
The consolidation eventually developed into a flag pattern. On Friday, the stock gave a decisive breakout from this formation on strong volumes and closed at a fresh all-time high. The combination of a price breakout and higher volumes adds strength to the bullish setup.
Relative Strength and Moving Averages Remain Positive
The stock has an RS Rating of 95, indicating strong relative outperformance compared with a large number of stocks in the market.
It is also trading above its key short-, medium- and long-term moving averages. More importantly, these averages are aligned in a favourable sequence and continue to trend higher, reflecting strength across multiple time frames.
Momentum Indicators Support the Bullish Setup
The 14-period daily RSI has moved into bullish territory, while the weekly RSI remains in a strong bullish zone.
On the daily chart, the MACD is close to generating a bullish crossover. On the weekly chart, the MACD continues to move higher while remaining above its nine-period average, supporting the positive momentum in the stock.
The Average Directional Index (ADX), which measures trend strength, is above the 25 level on both the daily and weekly charts. On the daily time frame, the +DI line has also crossed above the ADX line, indicating improving strength in the ongoing bullish trend.
Levels to Watch
Overall, TD Power Systems has registered a breakout from a flag pattern with strong volume participation, while momentum and trend indicators continue to favour the bulls.
As long as the stock sustains above the breakout zone, it has the potential to move towards Rs 860-880 in the short to medium term. Traders may keep a stop loss at Rs 740.
- Flat ₹20 Brokerage
- Next-gen Trading
- Advanced Charting
- Actionable Ideas
Trending on 5paisa
01
 5paisa Capital Ltd
Disclaimer: Investment in securities market are subject to market risks, read all the related documents carefully before investing. For detailed disclaimer please Click here.