
Nifty Trade Setup for October 13: Nifty Slips 0.70% After Reversing Early Gains, Will 22,220 Support Hold?

 Indrashish Mitra
- 0 min read
Indrashish Mitra
- 0 min read
Last Updated: 12th October 2026 - 05:55 pm

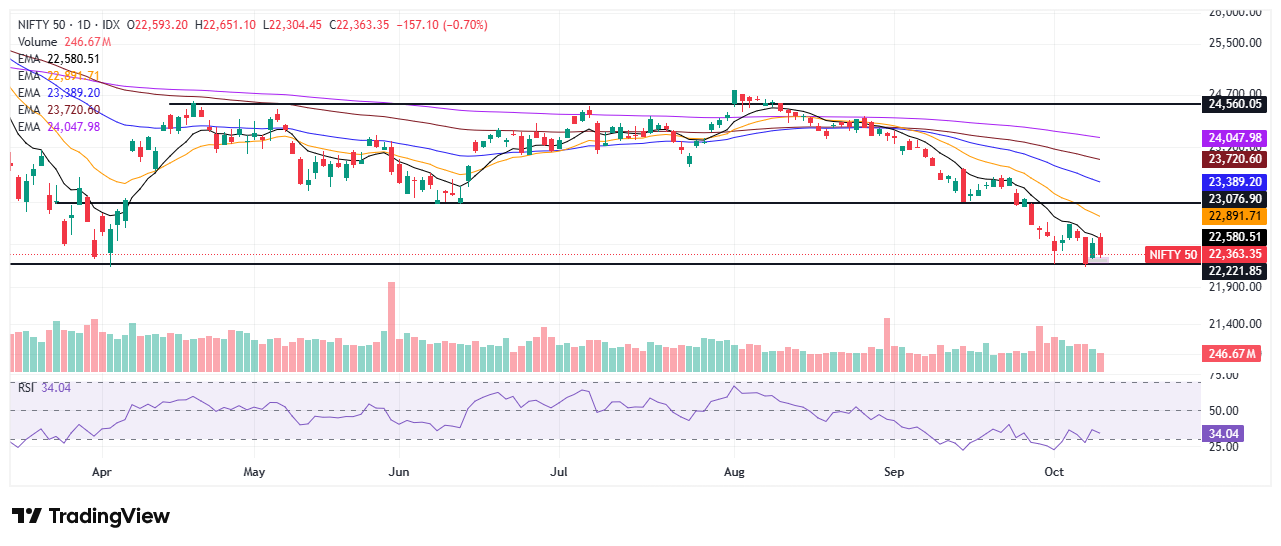
The Nifty 50 declined 157.10 points, or 0.70%, to close at 22,363.35 on October 12, giving up its early gains as selling pressure returned. The index opened at 22,593.20, touched an intraday high of 22,651.10 and fell to 22,304.45. Concerns over elevated crude oil prices, foreign fund outflows and uncertainty around inflation continued to weigh on sentiment. The market's inability to sustain its opening strength indicates that the recovery remains fragile.
Market Breadth Remains Weak as Selling Pressure Continues
Market breadth remained negative, with 14 stocks advancing and 36 declining among the Nifty 50 constituents. Nifty50 Media, Nifty50 Defence and Nifty50 Auto were among the sectors showing relative strength, according to the supplied market data. Despite pockets of buying, the broader index struggled to sustain higher levels, reflecting continued caution among investors.
Nifty Technical Setup: Index Struggles Below 22,600 as Bears Retain Control
On the daily chart, Nifty closed at 22,363.35, below its short-term EMA near 22,580.51 and the next EMA resistance around 22,891.71. The index continues to trade below its major moving averages, keeping the broader trend bearish. The 22,221.85 level remains a crucial support zone. A decisive break below this level could expose the index to further downside towards the psychological 22,000 mark.
The hourly chart shows Nifty trading below its EMA cluster around 22,386–22,537, indicating that selling pressure remains dominant despite a modest intraday recovery. On the 15-minute chart, the index is hovering near the short-term EMA around 22,348, while higher averages remain above the current price. A sustained move above 22,427–22,537 would be needed to improve the short-term setup. Failure to reclaim this zone could keep the index vulnerable to renewed selling.
RSI Signals Weak Momentum Despite an Intraday Recovery
The daily RSI stands at 34.04, remaining below the neutral 50 mark and reflecting weak broader momentum. The hourly RSI is at 42.44, while the 15-minute RSI is at 44.53. These readings suggest that the intraday recovery has not yet translated into a meaningful improvement in momentum. A move above 50 on the hourly RSI, accompanied by a sustained rise in price, would provide a stronger indication that buying interest is returning.
Key Levels to Track for Nifty
For the next session, 22,300–22,222 is the immediate support zone. A decisive break below 22,221.85 could bring 22,000 into focus. On the upside, 22,427–22,537 is the first resistance zone, followed by 22,580–22,600. If Nifty reclaims and sustains above 22,600, the recovery could extend towards 22,750–22,890. However, unless the index moves above its short-term EMA resistance levels, the broader trend is likely to remain under pressure.
- Performance Analysis
- Nifty Outlook
- Market Trends
- Insights on Market
Trending on 5paisa
Disclaimer: Investment in securities market are subject to market risks, read all the related documents carefully before investing. For detailed disclaimer please Click here.