
Breakout Stock to Watch: Pharma Stock Breaks Out on Highest Volume in 10 Weeks

 Indrashish Mitra
- 0 min read
Indrashish Mitra
- 0 min read
Last Updated: 4th September 2026 - 06:52 pm

The Nifty 50 extended its decline for the fourth consecutive week, keeping the market sentiment cautious. However, despite the weakness in benchmark indices, stock-specific opportunities continued to emerge as several companies showed strong price action and technical strength, during the week.
One such stock that has attracted attention is Wockhardt (WOCKPHARMA), which has witnessed a breakout on the weekly chart and could remain on traders’ radar in the coming week.
Breakout Stock to Watch for Swing Trading: Wockhardt (WOCKPHARMA)
Wockhardt is a global pharmaceutical and biotechnology company focused on developing innovative anti-infective therapies. The company has been working towards addressing antimicrobial resistance through its next-generation antibiotic pipeline.
Its research pipeline includes six antibiotics at different stages of clinical development and commercialisation. Three of these target infections caused by Gram-negative pathogens, while the remaining three focus on Gram-positive pathogens. All six antibiotics have received Qualified Infectious Disease Product (QIDP) designation from the US FDA, highlighting their importance in addressing serious bacterial infections.
Technical Setup: Stock Breaks Out of Consolidation Pattern
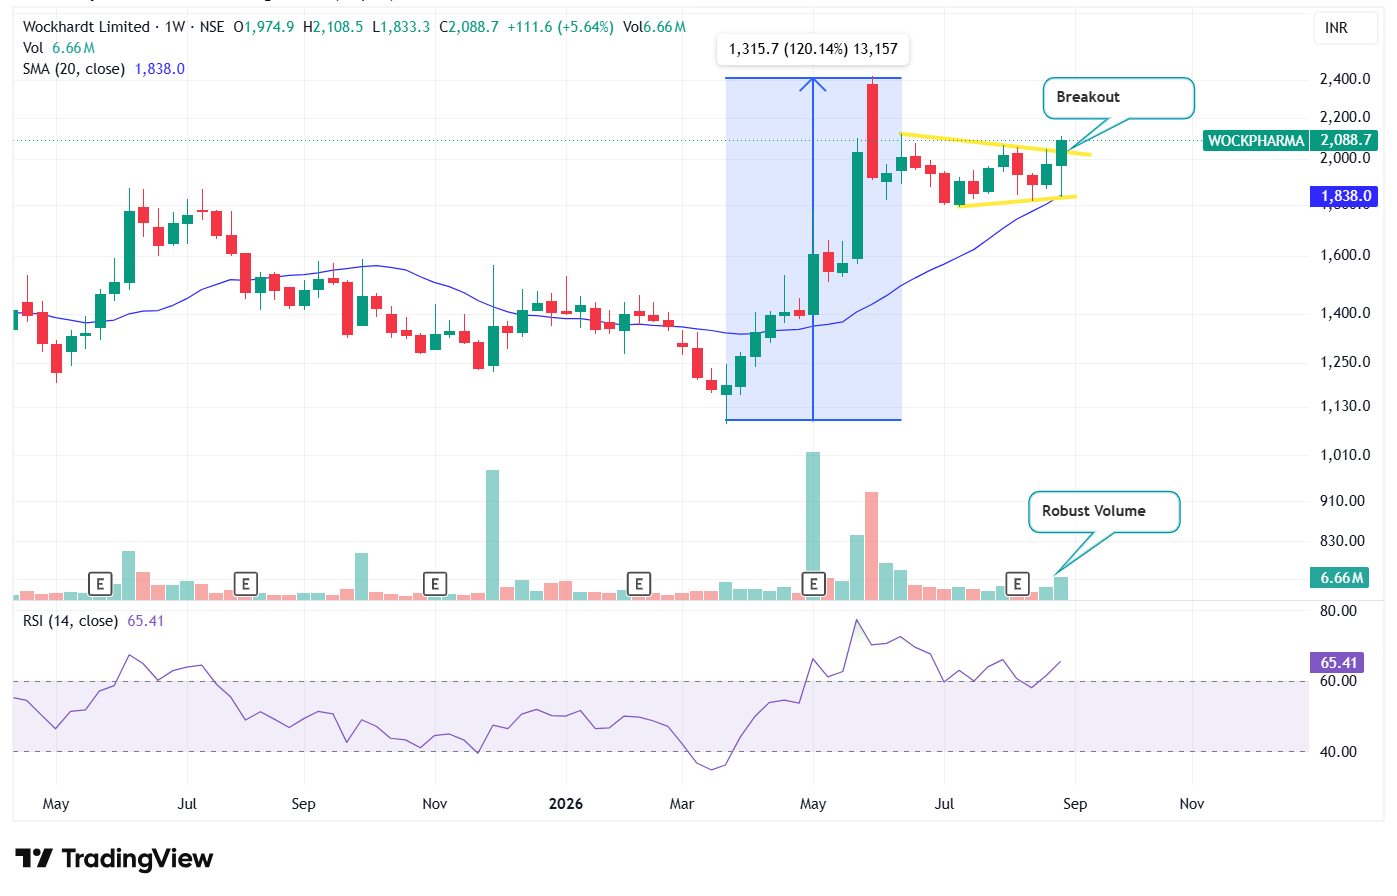
From a technical perspective, Wockhardt witnessed a sharp rally of nearly 120% from its March low to the June high. Following this strong upmove, the stock entered a corrective phase, during which the rising 20-week moving average provided strong support.
The consolidation phase resulted in the formation of a triangular pattern on the weekly chart. The stock has now given a breakout from this pattern, supported by strong volumes. The weekly volume recorded during the breakout was the highest in the last 10 weeks, indicating increased participation from market participants.
Momentum Indicators Turn Positive
On the daily chart, Wockhardt is trading above its key short-, medium-, and long-term moving averages, indicating a positive trend across multiple time frames.
The 14-period daily RSI remains in bullish territory, while the weekly RSI has shifted into the super bullish zone, reflecting improving momentum. The daily MACD has also moved above its nine-period average, supporting the positive technical outlook.
Trading Strategy and Key Levels
Considering the favourable technical setup, sustaining above the Rs 2,110–2,120 zone would keep the positive momentum intact. On the upside, the stock has the potential to move towards the Rs 2,300–2,420 range.
Traders can maintain a stop loss at Rs 1,830 to manage downside risk. A sustained move above the breakout zone with continued volume support could further strengthen the bullish setup.
Disclaimer: Investment/Trading in securities Market is subject to market risk, past performance is not a guarantee of future performance. The risk of loss in trading and investment in Securities markets including Equites and Derivatives can be substantial.
https://www.5paisa.com/disclaimer-research-services
- Flat ₹20 Brokerage
- Next-gen Trading
- Advanced Charting
- Actionable Ideas
Trending on 5paisa
 5paisa Capital Ltd
Disclaimer: Investment in securities market are subject to market risks, read all the related documents carefully before investing. For detailed disclaimer please Click here.