 Tanushree Jaiswal
 Ruchit Jain
How Long Gold Price Sustain to...
by
Tanushree Jaiswal
08/05/2024

U.S. Natural Gas prices plunged to new 52-week lows despite a sharp drop in inventories data with continued forecasts for warmer than normal weather till late January. European gas prices also fell back to pre-war levels, as a bout of mild weather reduced demand and eased fears of a prolonged supply crunch.
Benchmark futures fell as much as 15% as a warm spell curbs heating demand and blustery conditions cut use of gas in power generation. Mild weather has spread across the region, with temperatures breaking monthly records in several locations at the start of January.
Natural Gas Slumps to Lowest Since 2021 as Winter Fears Ease
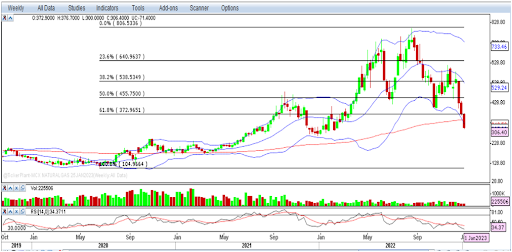
MCX natural gas prices dropped more than 20% during the week, while in the last three weeks, the correction has been on pace from the high of Rs. 535 to 300. On the weekly as well as monthly charts, the price has slipped below the support of 61.8% Retracement Levels, which indicates further downside in the near term. Moreover, on a weekly timeframe, the price has sustained below 200-weeks EMA, which suggests a weak trend for the long term. A momentum indicator, RSI, is showing negative crossover but hovering near to the oversold zone. The price has also moved below the Lower Bollinger Band and the Ichimoku Cloud formation. Overall, all the major indicators witness negative momentum in prices for the near term. So, based on the above structure, we are expecting a bearish movement in natural gas for the coming week.
Hence, traders are advised to follow the sell-on rise strategy in natural gas for the coming week. One can look for selling around 308/310 levels for the potential target of 270/255 levels, which could be considered as support for the prices. However, on the upside, 335/350 will be the resistance zone for the prices.
|
MCX Natural Gas (Rs.) |
NYMEX Natural Gas ($) |
|
|
Support 1 |
270 |
3.02 |
|
Support 2 |
255 |
2.41 |
|
Resistance 1 |
335 |
4.22 |
|
Resistance 2 |
350 |
4.95 |
Disclaimer: Investment/Trading in securities Market is subject to market risk, past performance is not a guarantee of future performance. The risk of loss in trading and investment in Securities markets including Equites and Derivatives can be substantial.


