PVR Inox share price rose to a fresh 52-week high on Friday, September 18, 2026, as the stock extended its gains following the company’s ₹300-crore share buyback and continued improvement in operating metrics. PVR Inox shares touched ₹1,310
The broader market has been volatile in 2026, but some stocks have continued to move higher. A few are now sitting just below their 52-week highs, showing that buying interest has remained strong despite the uncertain market environment. The five
Indian equity markets came under pressure on Tuesday after giving up their early gains. The Nifty 50 opened at 23,576.15 and moved up to 23,592.85 in early trade. Selling pressure then picked up as the session progressed. The Nifty 50 fell 1.19% t
Trading activity in some stocks stood out on Friday as investors continued to track individual stocks despite weakness in the broader market. Pine Labs, YES Bank and Anlon Healthcare Ltd recorded strong price gains along with high trading volumes. T
The week gone by remained challenging for the Indian equity market, with the Nifty 50 closing lower in four of the five trading sessions. The index also extended its weekly losing streak to five weeks, declining 2.09%. Despite weakness in the broader
Have you ever seen a stock keep rising and wondered if the trend is about to turn? The failure swing pattern can help traders spot early changes in momentum via the Relative Strength Index (RSI). The pattern is formed as the RSI turns course near
An index can rise or fall without showing how many stocks are actually participating in the move. Market breadth gives traders that missing view by tracking measures such as advancing and declining stocks, new highs and lows, and the percentage of st
Promoter pledge data is easy to miss in a standard fundamental analysis. When you read a company's annual report or results presentation, you read about its ratios, its management, and its credit history. One line often missed: how much of the promot
A stop-loss prevents a small bad trade from becoming a big problem for the account. Instead of holding on and hoping the market turns, you pre-decide the price at which the position will close if the trade goes the wrong way. This is known as the sto
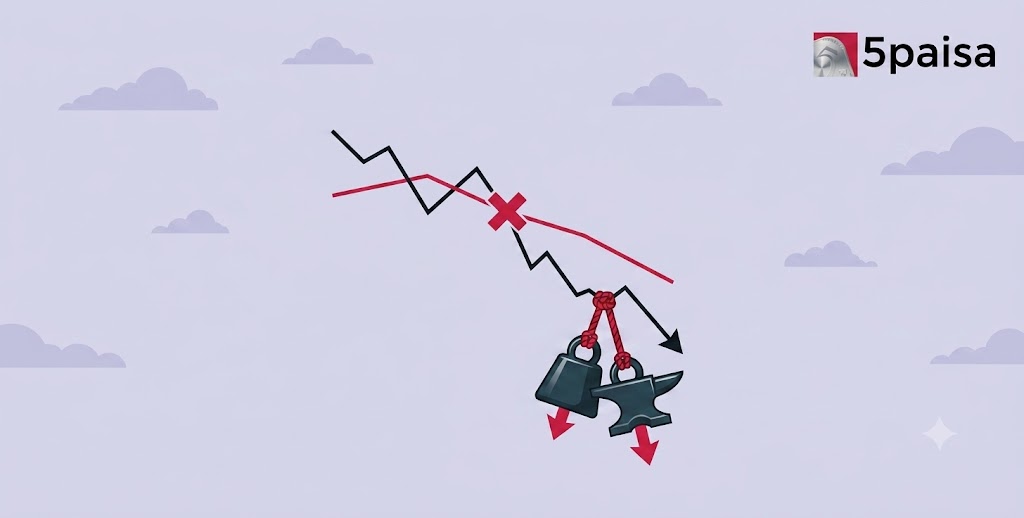
The Death Cross is a widely followed bearish technical indicator that occurs when a stock’s 50-day moving average (DMA) falls below its 200-day moving average (DMA). It is generally viewed as a sign of weakening price momentum and may indicate the
The 50-day moving average (50 DMA) is a widely followed technical indicator used to gauge a stock’s short- to medium-term price trend. When a stock trades below its 50 DMA, it generally signals weaker price momentum and near-term selling pressure,
The 200-day moving average (200 DMA) is one of the most widely followed technical indicators used to assess a stock’s long-term trend. When a stock trades below its 200 DMA, it is generally viewed as being in a long-term downtrend or experiencing s
Be a part of 5paisa community - The first listed discount broker of India.
By proceeding, you agree to all T&C*