 Ruchit Jain
 Sachin Gupta
 Tanushree Jaiswal
Weekly Outlook on Natural Gas ...
by
Sachin Gupta
10th Jun 2024

Last Updated: 16th January 2023 - 02:26 pm
Crude oil prices traded flat on Friday but were on track with more than 4% gains for the week on solid signs of demand growth from the top importer China and expectations of a less aggressive interest rate rise in the US.
MCX crude oil has contributed a more than 3% gain while Brent oil jumped 6.7% for this week, followed by WTI crude oil with 6.2%, recouping most of last week's losses.
Dollar prices were dragged to a nine-month low after data showed U.S. inflation fell to its lowest since 2021 in December, supporting the oil market, as a weaker greenback tends to boost oil demand as it makes the commodity cheaper for buyers holding other currencies.
According to the recent report from Morgan Stanley, the tight supply could support oil prices for the coming quarter. The bank said in a note on Wednesday," We see the oil market to be tight in Q3 & Q4 and Brent prices in the first quarter to remain range bound around $80-85 per barrel. It saw prices reaching $110 a barrel by the end of the year.
On the NYMEX, WTI crude oil prices recovered from last week's low and managed to trade above $75 with weekly gains of 6.2%. The price has taken support at a lower Bollinger Band formation and sustained above 21-days SMA on the daily chart. On a weekly scale, it is still trading within a prior week candle and finding a hurdle around $82. While the stochastic indicator has jumped to 56 levels from the oversold zone, that suggests further strength for the near term. On the downside, the price has support at $70 while, on the upside, it may find resistance around $86.
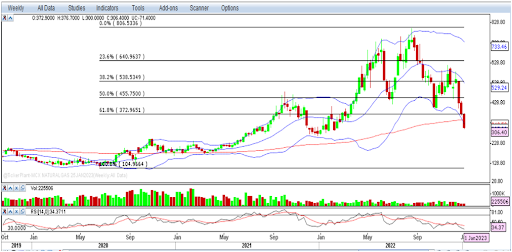
On the MCX exchange, crude oil prices recovered more than 300 points from the psychological support of Rs.6000 and managed to trade at 6350 levels. Overall, the price has been rising for the last four consecutive sessions with favorable volume activity but still trading below 50-days SMA. A momentum indicator RSI reading is at 49 marks with a positive crossover, which indicates that recovery moves to be continued for the coming days.
Hence, traders are advised to look for buying in dips in crude oil for the next one to two weeks. However, the upside could be limited as the overall structure is still looking weak. On the downside, the price has support at 6000 levels, while on the upside; the resistance comes at 6850 levels.
|
MCX CRUDE OIL (Rs.) |
MCX CRUDE OIL (Rs.) |
|
|
Support 1 |
6000 |
70 |
|
Support 2 |
5830 |
65 |
|
Resistance 1 |
6850 |
86 |
|
Resistance 2 |
7000 |
93 |
Disclaimer: Investment/Trading in securities Market is subject to market risk, past performance is not a guarantee of future performance. The risk of loss in trading and investment in Securities markets including Equites and Derivatives can be substantial.


Want to Use 5paisa
Trading App?


