 Ruchit Jain
 Sachin Gupta
 Tanushree Jaiswal
Weekly Outlook on Natural Gas ...
by
Sachin Gupta
10th Jun 2024

Last Updated: 11th September 2023 - 02:54 pm
Natural gas prices rebounded after the EIA report on Thursday. As per the report, working gas in storage grew by 18 billion cubic feet for the week, which was below the average increase of 29 bcf forecast by analysts surveyed by S&P Global Commodity Insights. In addition, traders are also keeping an eye on the developments in Australia, Woodside Energy reached an agreement with the unions at Australia’s LNG project, potentially averting a disruption to supplies from one of the world's biggest exporters of super-chilled fuel. However, the U.S. market will not be impacted by the development in Australia, but the potential strike could be a positive for natural gas prices in the U.S. as consumers would rush to buy LNG everywhere they could find it.
Natural Gas prices inched up after EIA report
NYMEX Natural gas prices triggered a bearish continuation early in the session but towards the end witnessed a pullback move. Initially, the price breached its prior low of 2.470, before finding support around 2.425 and bouncing back. Finally, the daily candle ended in green after being red earlier and closed back above 2.470 levels on Thursday. On the Friday session, the prices were promising bullish strength and hovering above the prior day's close. On the daily timeframe, the price has tested support at 50% Retracement Levels of its prior upward rally and reversed further. For the coming days, if the natural gas price sustains above 2.570 levels on a closing basis, then bulls can take control and start recording a positive target at 2.950 followed by 3.557. However, if the price declines below the mentioned support and provides a negative close, that will confirm its negative pressure between 1.950 and 1.650.
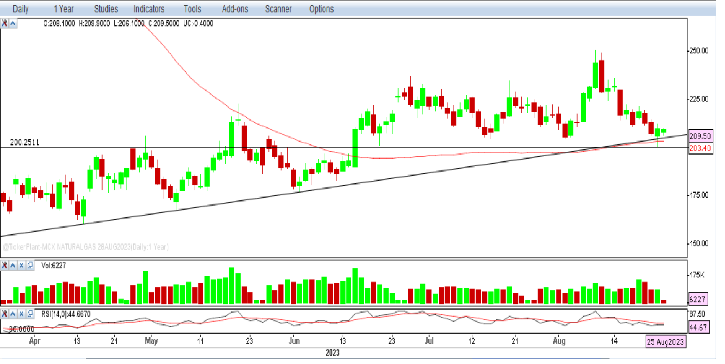
On the MCX exchange, natural gas turned up from the prior support at 203. The price dragged below it and set a low at 200.60 on Thursday session but managed to settle above the support levels. However, in the first half of the session, the prices were under pressure, but after the inventory data, we witnessed a sharp pullback in the counter. On Friday, the price opened slightly lower and traded sideways in the early session. On the daily scale, the price took support at Rising Trendline and 100-days Simple Moving Averages and showed pullback moves. However, RSI and other momentum indicators are still looking weak and suggesting bearishness for the near term. Hence, one should keep an eye on the ongoing fundamentals and market events that can drive prices further. Technically, there is strong support at around 200 levels. Once the prices slip below it, will confirm the negative affection by strong selling pressure. However, on the upside, if the price sustains above 215 can see positive moves towards 224 and 235 levels.
|
MCX Natural Gas (Rs.) |
NYMEX Natural Gas ($) |
|
|
Support 1 |
200 |
2.425 |
|
Support 2 |
187 |
1.950 |
|
Resistance 1 |
224 |
2.950 |
|
Resistance 2 |
235 |
3.557 |
Disclaimer: Investment/Trading in securities Market is subject to market risk, past performance is not a guarantee of future performance. The risk of loss in trading and investment in Securities markets including Equites and Derivatives can be substantial.


Want to Use 5paisa
Trading App?


Crude prices retreated on Thursday after rallying over 7% in the past 10 sessions, driven by strength in the dollar and fears of an economic slowdown in major consumers weighed. Data revealed China's trade surplus narrowed more than expected, with declining exports attributed to softer external demand and imports suffering losses due to weak domestic consumption. While China’s oil imports jumped over 30% in August, overall exports and imports in the country still declined substantially in the month.
Oil ticks higher as tight supply boost the sentiments
Despite demand concerns, WTI & Brent oil prices traded to their highest level since November 2022, buoyed by a tighter supply outlook after major producer Saudi Arabia & Russia flagged bigger than expected supply cuts this week. Saudi will maintain its 1 million barrel per day production cut till the end of this year, while Russia will continue its 300,000 barrel export reduction until end-2023.
U.S. demand, however, remained strong, as crude oil stockpiles were down by 6.3 million barrels last week, falling for a fourth consecutive week and down over 6% in the last month, government data showed.
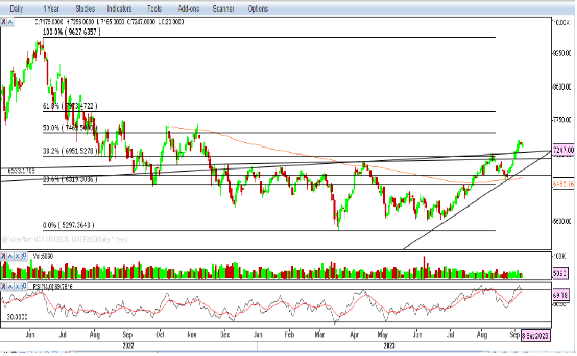
From a technical prospect, WTI oil prices have been hovering above the breakout of $84.89 levels and chasing towards $89. While brent oil is hovering near the $90 mark with bullish sentiments. The bullish rally may continue further as all the key indicators suggest a bullish bias for the near term. Positive optimism about stimulus measures from China could also support prices. However, the dollar index (DXY) jumped to a six-month peak on Thursday and traded near 105. On the upside, there is an immediate hurdle around the $105.80 mark, which could accelerate further reversal in prices.
On the MCX front, the market witnessed a long liquidation, with open interest dropping by -24.43% and settling at 8273. Support for crude oil is expected at around 7100 levels followed by 6950. Resistance is likely at 7370, and a move above this level could lead to the target of 7600.
|
MCX CRUDE OIL (Rs.) |
WTI CRUDE OIL ($) |
|
|
Support 1 |
7100 |
82 |
|
Support 2 |
6950 |
74 |
|
Resistance 1 |
7370 |
93 |
|
Resistance 2 |
7600 |
98 |
