 Sachin Gupta
 Ruchit Jain
 Tanushree Jaiswal
by
Sachin Gupta
26th Jul 2024
Natural Gas Outlook

Last Updated: 13th December 2022 - 10:45 am
Natural gas prices surged during the week followed by Russia’s Gazprom announcement to close the Nord Stream pipeline completely for three days of maintenance on Aug.31 and prices rose above $10 per million btu for the first time since 2008. The Nord Stream pipeline is currently operating at just 20% of capacity, with only one turbine operational.
Overall, gas prices have surged all over the world after Russia’s invasion of Ukraine intensified a global energy crunch. Meanwhile, gas prices in Europe are far higher than in the US as fears of severe winter shortages grip the market, spreading concerns that energy costs will tip economies into recession.
Natural Gas Report
According to the EIA report, the latest weekly inventories rose by 60bcf compared to an average forecast of 54bcf, polled by analysts. Total working gas stocks in storage stand at 2.579tcf, down by 268bcf from a year ago.
NYMEX natural gas prices were trading at $9.556/MMBtu, up by 2% from the Thursday close but lower from the $10.028/MMBtu 2008 highs. Overall, prices have been trading in bullish territory for the last four weeks and hovering above their prior swing highs. The price has sustained above the Parabolic Sar & Middle Bollinger Band formation. However, on the daily timeframe, it has formed like a Bearish Engulfing a candlestick pattern that indicates further correction. A momentum indicator RSI reading is at 63 and Stochastic is trading near 68 levels with negative crossover. On the downside, Natural Gas has support at $9.05 & $8.75 levels. While on the upside, the resistance is at $10.02/ $10.34 levels.
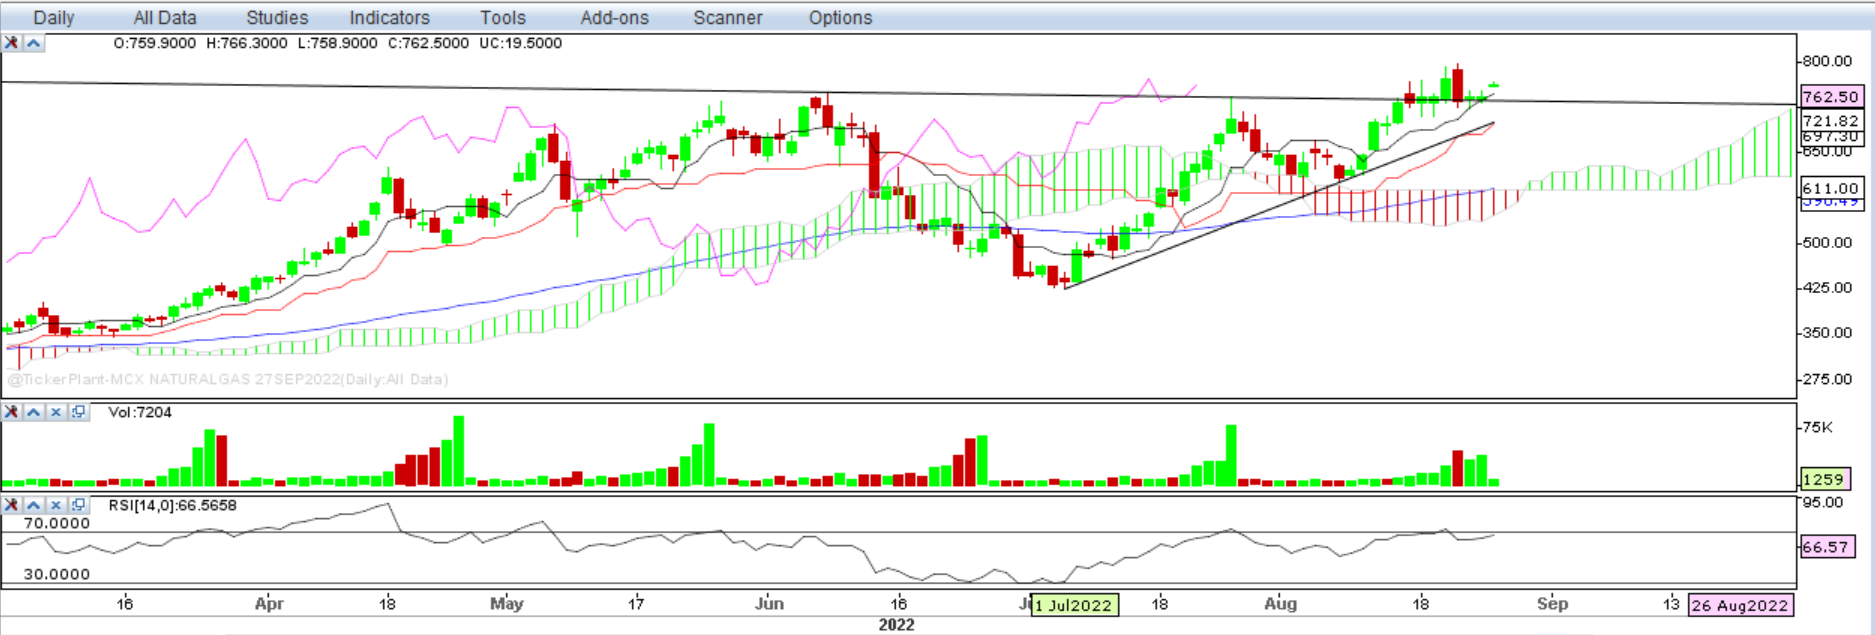
On the MCX exchange, natural gas prices were trading at Rs.761 with 2.5% gains on Friday's session. On the daily chart, it has confirmed the Bullish Flag pattern breakout and moved above the prior swing highs. The rising volume activity also added confidence among the trader. In addition, the prices have been moving above Ichimoku Cloud, which suggests a bullish trend for the long term. The CCI indicator is at 97.30 levels, which shows positive strength to reach the above 100 mark. So, based on the above technical structure, we are expecting a sideways to positive move in Natural Gas for the coming week. Traders are advised to trade cautiously with the proper SL & target and keep the trail SL in existing positions.
Important Key Levels:
|
MCX Natural Gas (Rs.) |
NYMEX Natural Gas ($) |
|
|
Support 1 |
708 |
9.05 |
|
Support 2 |
675 |
8.75 |
|
Resistance 1 |
800 |
10.02 |
|
Resistance 2 |
832 |
10.34 |
Characters remaining
(1500)
View All
Disclaimer: Investment/Trading in securities Market is subject to market risk, past performance is not a guarantee of future performance. The risk of loss in trading and investment in Securities markets including Equites and Derivatives can be substantial.
FREE Trading & Demat Account
Trending on 5paisa
Discover more of what matters to you.
Commodities Related Articles


by
Sachin Gupta
15th Jul 2024

by
Sachin Gupta
1st Jul 2024

Weekly Outlook on Natural Gas - 07 June 2024
by
Sachin Gupta
10th Jun 2024

Weekly Outlook on Gold - 24 May 2024
by
Sachin Gupta
27th May 2024
Want to Use 5paisa
Trading App?


