 Sachin Gupta
 Ruchit Jain
 Tanushree Jaiswal
by
Sachin Gupta
26th Jul 2024
Weekly Outlook on Gold - 17 Oct 2022

Last Updated: 10th December 2022 - 03:18 pm
Gold prices slipped on Thursday after the U.S. CPI inflation data read higher than expected for September. However, prices recovered sharply after a low of $1648.30, tracking a broader risk-on rally that could weaken the dollar. Overall, the gold price was clouded over a week, followed by better Inflation and unemployment data. Improvement in the U.S. data witnesses another interest rate hike by the Fed in the coming month.
The central bank has increased interest rates by 300bps since March to control stubborn inflation and is likely to add another 125bps by the end of this year. Holdings of SPDR Gold Trust, the world’s largest gold-backed exchange-traded fund, fell 0.12% to 944.31 tonnes on Thursday. The world’s second-largest gold miner, Barrick Gold Corp, said on Thursday that, during the year, gold production is expected to be at the lower end of its earlier forecast range.
On the COMEX division, gold prices have dropped more than 2.5% over a week to trade at the $1670 mark. Overall, the price has been trading with lower highs & lower lows that suggest pressure for the near term. On the daily chart, the price has traded below 50-Days Simple Moving Averages and also below the prior swing lows that indicates bearish momentum. On the downside, it may find support around $1630/$1600 levels. While on the upside, the resistance zone is around $1690/$1715 levels.
Weekly outlook on Gold
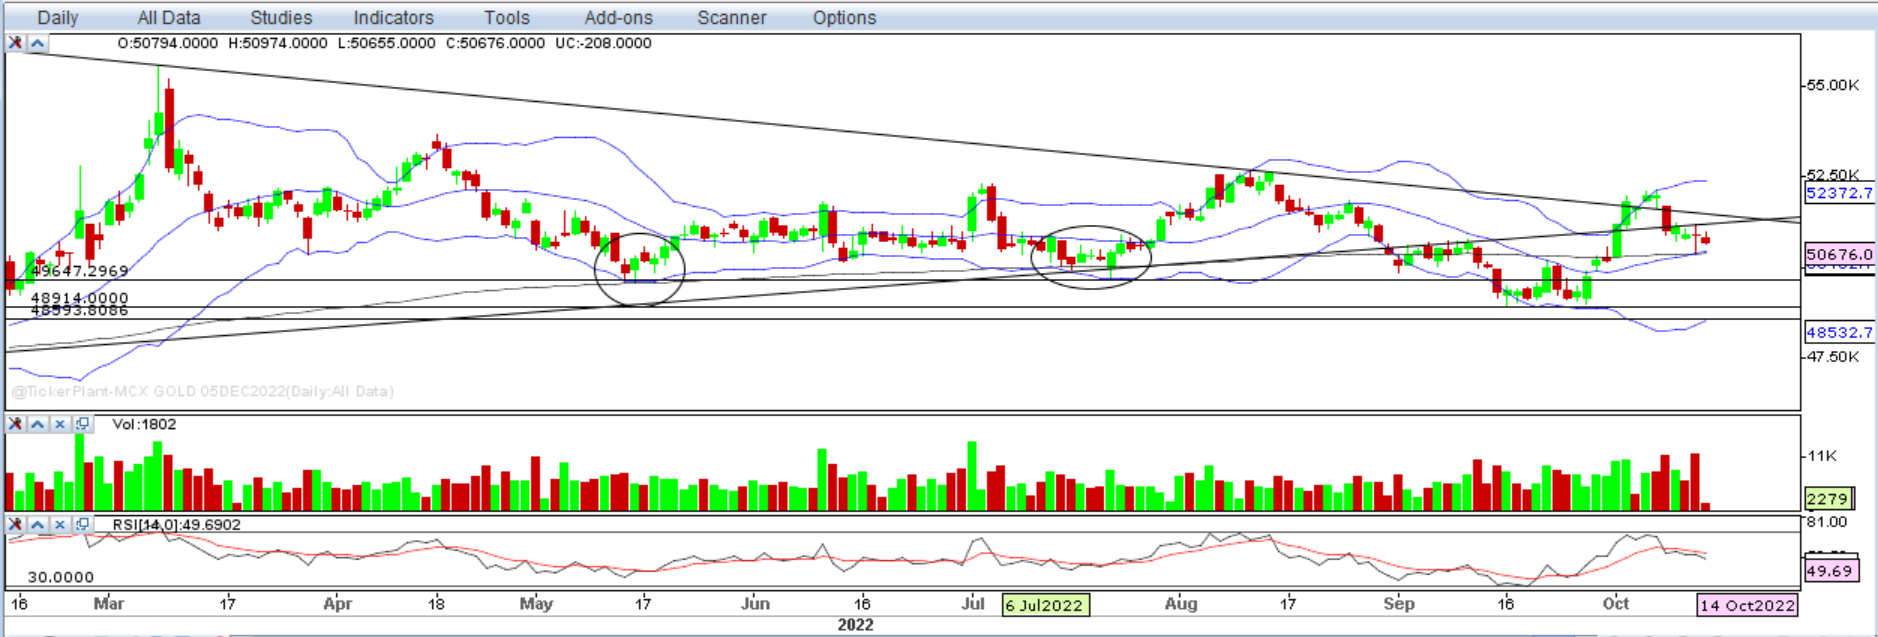
On the MCX, the gold price failed the Symmetrical Triangle breakout, moved below the lower line of the pattern and also formed a Doji candlestick on Thursday's session that suggested indecisiveness among the traders. However, the price has still been holding the support of 200-days Exponential Moving Averages that shows positive strength for the long term. Moreover, price has also taken support at Middle Bollinger band formation. However, the volume has been rising in negative territory along with a negative crossover in RSI. Hence, we are expecting a sideways move in the Gold future until it closes below 50400 levels. Once the gold price remains below it, one can look for a short position for the target of Rs. 49800 & Rs. 49300 levels. On the higher side, Rs. 51300 & Rs. 51700 will act as resistance zones for the gold.
Important Data:
|
Philly Fed Manufacturing Index |
USD |
|
Unemployment Claims |
USD |
|
Existing Home Sales |
USD |
|
Retail Sales m/m |
GBP |
Important Key Levels:
|
MCX GOLD (Rs.) |
COMEXGOLD ($) |
|
|
Support 1 |
49800 |
1630 |
|
Support 2 |
49300 |
1600 |
|
Resistance 1 |
51300 |
1690 |
|
Resistance 2 |
51700 |
1715 |
Characters remaining
(1500)
View All
Disclaimer: Investment/Trading in securities Market is subject to market risk, past performance is not a guarantee of future performance. The risk of loss in trading and investment in Securities markets including Equites and Derivatives can be substantial.
FREE Trading & Demat Account
Trending on 5paisa
Discover more of what matters to you.
Commodities Related Articles


by
Sachin Gupta
15th Jul 2024

by
Sachin Gupta
1st Jul 2024

Weekly Outlook on Natural Gas - 07 June 2024
by
Sachin Gupta
10th Jun 2024

Weekly Outlook on Gold - 24 May 2024
by
Sachin Gupta
27th May 2024
Want to Use 5paisa
Trading App?


