 Sachin Gupta
 Ruchit Jain
 Tanushree Jaiswal
by
Sachin Gupta
26th Jul 2024
Weekly Outlook on Natural Gas- 12 May 2023

Last Updated: 15th May 2023 - 11:30 am
Natural gas prices failed to maintain momentum after the storage data showed a build of 78 bcf compared to small expectations for a build of 68 bcf. Prices declined by almost 3% from the day's high and settled at lows on Thursday. However, during the May 5-9 period, the price showed some pullback moves and traded higher consecutively for three days as the majority of U.S. locations were supported by strong power burns and easing production.
Moreover, Asian spot liquefied natural gas (LNG) prices hit a 23-month low on Friday on mild weather and weak restocking demand in China, Japan and Korea, while Europe enjoys 60% full inventories ahead of summer. The average LNG price for June delivery into northeast Asia LNG-AS was USD 11 per mmBtu, the lowest since June 2021.
Data provider Refinitiv said average gas output in the U.S. Lower 48 states held at 101.4 billion cubic feet per day (bcfd) so far in May, matching the monthly record hit in April. Daily, however, output was on track to drop by 1.3 bcfd over the past couple of days to a preliminary two-week low of 100.4 bcfd on Wednesday.
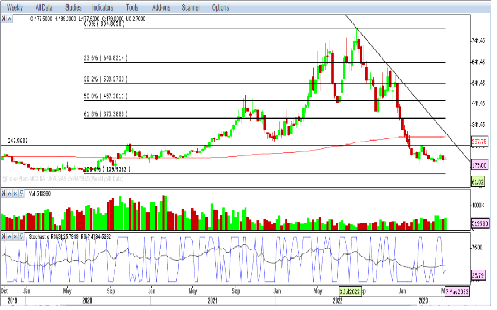
On the NYMEX front, gas prices declined after a small pullback move that indicates continued pressure in the gas market. All the key indicators are on the bearish side and suggest no sign of recovery. Overall, the trend may remain bearish until we find any strong demand. On the downside, it has support at $1.94 and, below the same, could see more downfalls till $1.72 and $1.58 levels. While on the upside, it is finding further resistance around $2.52 and $2.70 levels.
MCX, natural gas prices are also showing continued selling on the chart as the market witnessed a gain in open interest by 14% while prices are trading negatively that suggests further pressure in the near term. All the momentum indicators and oscillators show bearish trends. However, prices are already at the bottom, so volatility seems to be limited until the market breaks its important support at 160 levels.
Traders are advised to trade cautiously and follow the sell on rise strategy until the market indicates further recovery and any positive development in the fundamental.
Important Key Levels:
|
MCX Natural Gas (Rs.) |
NYMEX Natural Gas ($) |
|
|
Support 1 |
172 |
1.94 |
|
Support 2 |
160 |
1.72 |
|
Resistance 1 |
206 |
2.52 |
|
Resistance 2 |
218 |
2.70 |
Characters remaining
(1500)
View All
Disclaimer: Investment/Trading in securities Market is subject to market risk, past performance is not a guarantee of future performance. The risk of loss in trading and investment in Securities markets including Equites and Derivatives can be substantial.
FREE Trading & Demat Account
Trending on 5paisa
Discover more of what matters to you.
Commodities Related Articles


by
Sachin Gupta
15th Jul 2024

by
Sachin Gupta
1st Jul 2024

Weekly Outlook on Natural Gas - 07 June 2024
by
Sachin Gupta
10th Jun 2024

Weekly Outlook on Gold - 24 May 2024
by
Sachin Gupta
27th May 2024
Want to Use 5paisa
Trading App?


