 Sachin Gupta
 Ruchit Jain
 Tanushree Jaiswal
by
Sachin Gupta
26th Jul 2024
Weekly Outlook on Natural Gas - 21 Oct 2022

Last Updated: 13th December 2022 - 02:18 pm
Natural Gas prices started on a negative note and continued corrections throughout the week made a low at Rs. 436.60 on Thursday session and traded at 439 levels on Friday session. Overall, the price plunged more than 15% during the week, the lowest in three months, amid record domestic production levels and lower weather-driven demand.
As per the latest EIA report, the USA utilities added 125bcf of gas to storage last week, which is higher than the market expectation of 123 bcf a build. It was the fourth consecutive week of an increase in the storage above 100 bcf due to mild weather and an increase in wind power.
Further drop in the demand from the power outages due to hurricane Ian and reduced LNG exports kept the pressure on natural gas prices. Pressure has also been seen after the update that the UK’s gas storage facilities are 100% filled. Europe's wholesale gas prices were trading around the €130 per megawatt-hour mark, a level not seen since late June, as abundant supplies of LNG, particularly from the US, helped countries fill storage sites ahead of the winter season.
Weekly outlook on Natural Gas
NYMEX natural gas prices crashed more than 15% over a week from the high of $6.31 to $5.25, the lowest levels since July22. On a weekly chart, the price has formed a Double Top formation that suggests a bearish trend for the short term. A momentum indicator RSI & MACD also indicated weakness with negative crossover, which supports the downward trend for the near term. Hence, on the lower side, the price has support around $4.45 and $3.50 levels while resistance is at $6.31 and $7.20 levels.
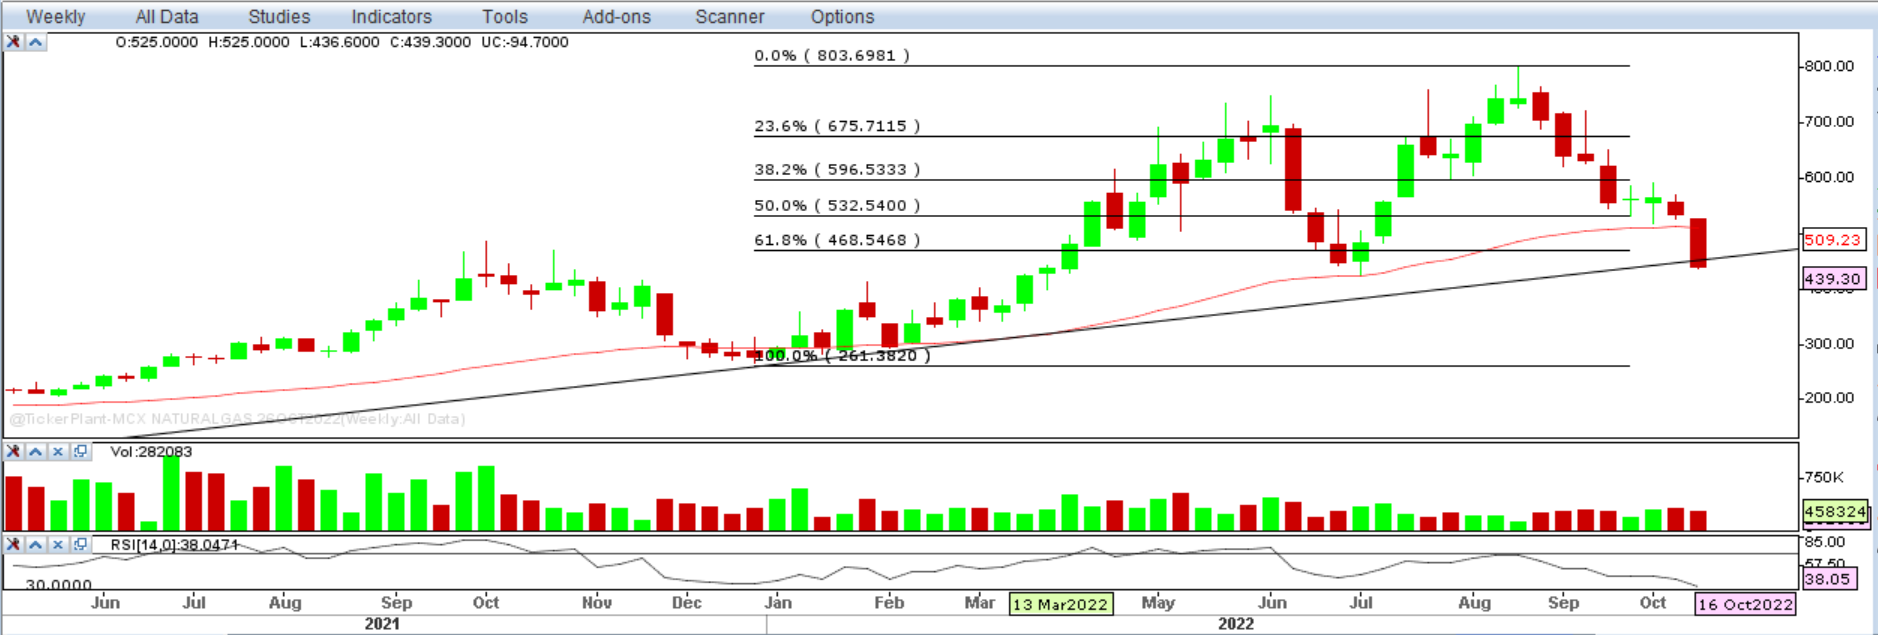
On the MCX exchange, natural gas witnessed a heavy sell-off during the week. Overall, the price has been falling since Aug’22 after setting a high of Rs. 801. On a weekly chart, the price has slipped below the 61.8% Retracement Levels of its prior rally. The price has been sustained below the rising Trendline and 50-week Exponential Moving Averages that show weakness in the counter. Furthermore, the price has also moved below the Ichimoku Cloud formation on the daily timeframe, which signals a bearish trend for the long term. So, based on the above technical structure, we are expecting more downside in Natural Gas future for the coming week. Traders are advised to sell on a rise strategy for the downside target of Rs. 425 and 410 levels, which may be considered as a support zone for the prices. While, on the upside the resistance is at 470 & 490 levels.
Important Key Levels:
|
MCX Natural Gas (Rs.) |
NYMEX Natural Gas ($ |
|
|
Support 1 |
425 |
4.45 |
|
Support 2 |
410 |
3.50 |
|
Resistance 1 |
470 |
6.31 |
|
Resistance 2 |
490 |
7.20 |
Characters remaining
(1500)
View All
Disclaimer: Investment/Trading in securities Market is subject to market risk, past performance is not a guarantee of future performance. The risk of loss in trading and investment in Securities markets including Equites and Derivatives can be substantial.
FREE Trading & Demat Account
Trending on 5paisa
Discover more of what matters to you.
Commodities Related Articles


by
Sachin Gupta
15th Jul 2024

by
Sachin Gupta
1st Jul 2024

Weekly Outlook on Natural Gas - 07 June 2024
by
Sachin Gupta
10th Jun 2024

Weekly Outlook on Gold - 24 May 2024
by
Sachin Gupta
27th May 2024
Want to Use 5paisa
Trading App?


