 Sachin Gupta
 Ruchit Jain
 Tanushree Jaiswal
by
Sachin Gupta
26th Jul 2024
Weekly Outlook on Natural Gas - 26 Sept 2022

Last Updated: 10th December 2022 - 01:25 pm
Natural gas prices fell about 7% in the last four trading sessions from the prior week close of Rs. 630 to Rs. 583 traded in the last trading session after the U.S federal reserve delivered another rate hike to control inflation that could dent's economic activity and demand for oil & gas. The Fed raised a 75 basis point interest rate for the third time in a row and also signalled for a continued hike until inflation comes under control.
According to the EIA report, U.S gasoline demand over the past four weeks fell to 8.5 million barrels per day, it’s lowest since February that data points out the continuing sluggishness in demand.
The Energy Minister Arifin Tasri stated that the Indonesia government is planning to launch second oil and gas bidding round later this year to boost the country output. He also added that the government would revise the oil & gas law and provide ease of doing business and contract certainty.
Germany agreed to nationalize natural gas company Uniper SE, while the British government said it would cap wholesale electricity and gas costs for business.
NYMEX natural gas prices crashed more than 8% during the week, trading near $7.13. Overall, in the last three weeks, prices corrected almost 18% from the high of $9.09. Technically, the price has slipped below the 38.2% Retracement Levels of its prior upward rally. The price has also moved below 21-weeks Simple Moving Averages that suggest bearishness in the counter. Hence, we are expecting a downward move in prices for the coming week. On the downside, it may find support at $6.80. Below that, corrections could be extended to $6.50 and $6.03 levels. However, on the upside, the resistance remains at $7.60 and $8.20 levels.
Natural Gas lost winning streak, price heads for fourth week losses
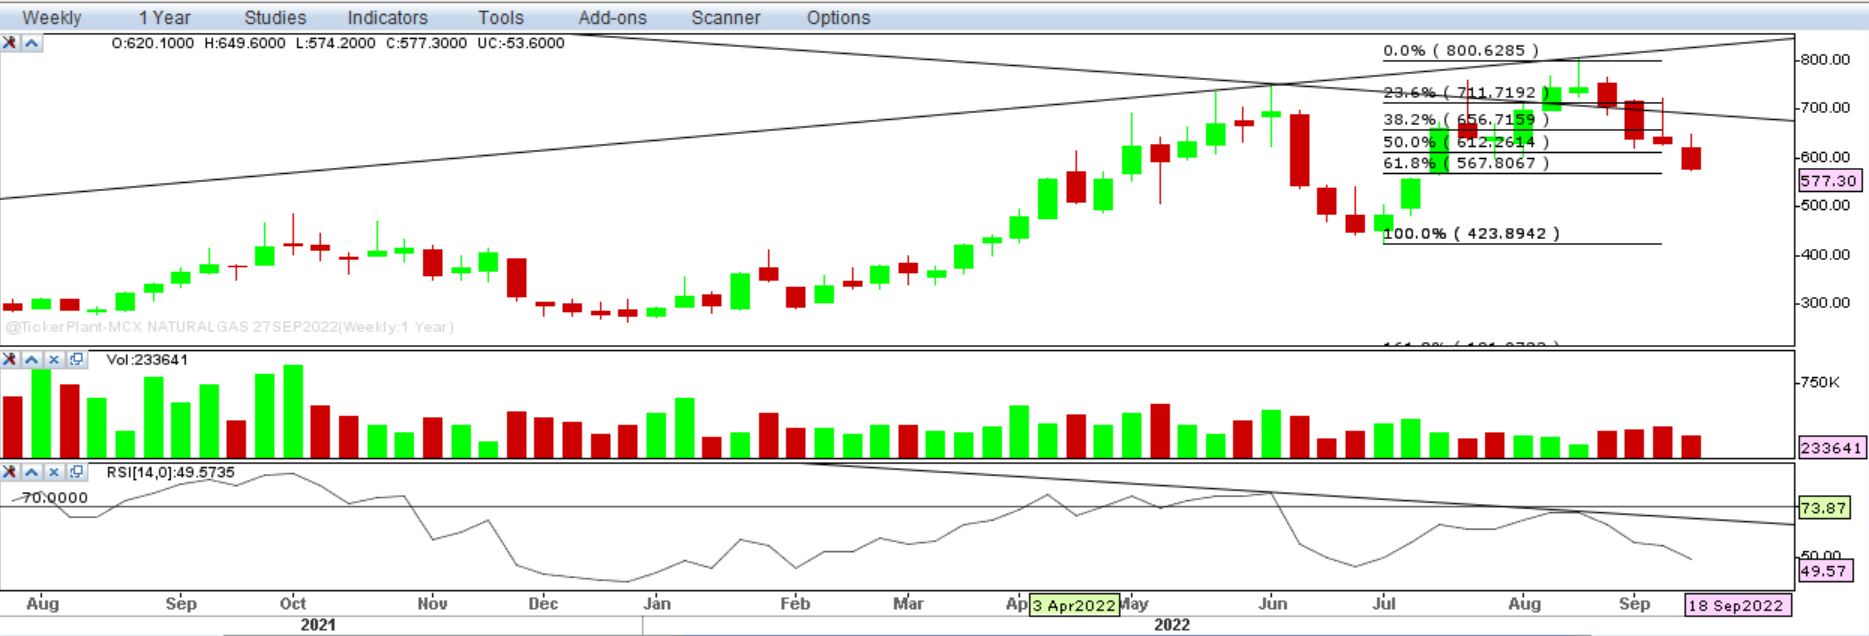
On the domestic front, the MCX natural gas prices breached significant support of Rs. 612, a 50% Retracement level of recent up rally and chasing towards 61.8% (Golden Ratio) to Rs.567. The price has been forming lower highs and lower lows since 28th August. On a weekly time frame, the price has shifted below the Middle Bollinger Band formation, which indicates a bearish move for the short term.
Moreover, in the earlier trades, when prices were trading at peaks around Rs. 790 and Rs. 800 marks, the RSI was continuously showing negative divergence on the chart, which was an indication of a correction. Hence, the down trend may continue further until we test 567 levels, which could be an important support for the counter. If prices sustain below it, the fall may continue to Rs. 530 levels. The traders are advised to watch out for 567 levels as immediate support. However, on the upside, the resistance may come around 612 and 656 levels.
Important Key Levels:
|
MCX Natural Gas (Rs.) |
NYMEX Natural Gas ($) |
|
|
Support 1 |
567 |
6.80 |
|
Support 2 |
530 |
6.50 |
|
Resistance 1 |
612 |
7.60 |
|
Resistance 2 |
656 |
8.20 |
Characters remaining
(1500)
View All
Disclaimer: Investment/Trading in securities Market is subject to market risk, past performance is not a guarantee of future performance. The risk of loss in trading and investment in Securities markets including Equites and Derivatives can be substantial.
FREE Trading & Demat Account
Trending on 5paisa
Discover more of what matters to you.
Commodities Related Articles


by
Sachin Gupta
15th Jul 2024

by
Sachin Gupta
1st Jul 2024

Weekly Outlook on Natural Gas - 07 June 2024
by
Sachin Gupta
10th Jun 2024

Weekly Outlook on Gold - 24 May 2024
by
Sachin Gupta
27th May 2024
Want to Use 5paisa
Trading App?


